


TFI International is the largest decentralized trucking operation in Canada and is actively looking to expand its U.S. presence in 2021.
The B2C & E-Commerce secular boom and the realization of synergies from M&A activities are tailwinds to its free cash flow margins.
It has a dividend yield of 1.7% and 20% FCF payout ratio. Management hiked the next quarterly dividend by 12% starting in January.
It is trading at an attractive price relative to its industrial peers and is an opportunity with the recent U.S. election jitters pullback.
Note: TFI International is publicly traded on the TSX Exchange under the symbol TFII with much higher liquidity. Also, all amounts discussed in this article are expressed in Canadian Dollars unless otherwise noted.
Introduction
TFI International (TFII) provides transportation and logistic services in the United States, Canada and Mexico. It creates value for its shareholders by integrating strategic acquisitions and managing a growing structure of wholly owned operating subsidiaries. As of September 30th, the company operates a decentralized network of 18,499 tractors, 25,720 trailers, and 368 facilities. It is headquartered in Montreal, Canada.
Mr. Alain Bedard is the President and CEO of the company since 1993. He is a well known and respected businessman with over 40 years of experience in the industry. He has overseen more than 88 acquisitions and helped generate more than 750% annualized return to shareholders since 2008.
Key Segments
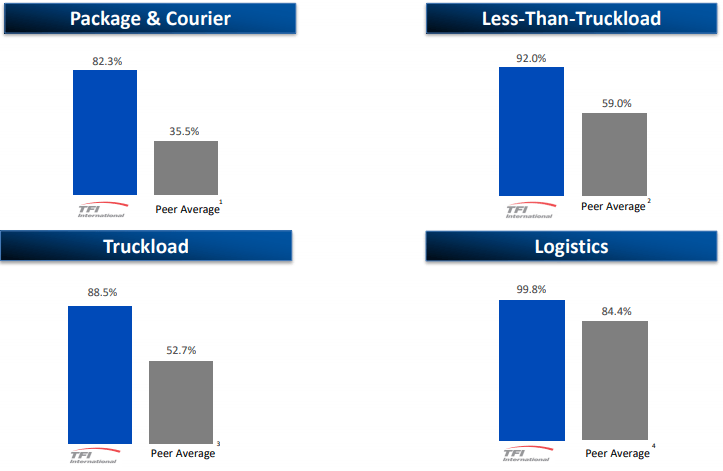
The company diversifies its operations in four segments: Package & Courier, Less-Than-Truckload, Truckload, and Logistics. TFI has proven its leadership role in those segments when we look at the FCF conversion ratio, calculated as the (Adjusted EBITDA – Net Capex Ex-Property) / Adjusted EBITDA:
- Package & Courier: FedEx and UPS.
- Less-Than-Truckload: ArcBest, Old Dominion Freight Line, Saia and YRC.
- Truckload: Heartland, Knight-Swift, Werner, Schneider and U.S. Xpress
- Logistics: CH Robinson, Landstar, Echo and Forward Air.
Package & Courier: 13% of Revenues
This covers the next-day delivery service in Canada and global deliveries through a partnership with DHL. The pandemic caused a slowdown in B2B activity but also a pickup in B2C activity. Overall, the customer base in this segment is now more diversified with a healthier mix of B2C and B2B.
Less-Than-Truckload: 16% of Revenues
This regroups both over-the-road and intermodal LTL services across North America. The weaker demand due to the pandemic was more than offset with the help of efficiencies. The successful merging of Canadian Freightways and TST Overland Express in May significantly benefited the operating margins.
Truckload: 47% of Revenues
The company derive 26% of its Revenues with conventional truckload operations. The remaining 21% of its Revenues are made with specialized truckload services. Despite structural challenges, TFI stabilized TL operating margins in Q3 2020 and should be on track for positive growth in 2021.
Logistics: 24% of Revenues
E-Commerce and same day package delivery are such strong drivers of growth that Alain Bedard qualified the last mile operation in Canada as “on fire”. Operating margins came stronger at 10.7% on Q3 2020, well above 5.4% from a year-ago due to various margin improvement initiatives.
Competitive Advantage
The company is evolving in a highly fragmented industry where each player tries to differentiate itself. TFI’s positioning is to offer on-time delivery at a reasonable price which drives satisfaction to the end customer. Regarding its employees, TFI pride itself in having a great track record for safety.
It generates roughly half of its revenues in Canada and the other half south the border. It boasts a wide range of customers with none representing more than 5% of revenues. Its key competitive advantage lies in its ability to identify immediately accretive M&A deals and integrate them because:
1. The company has a 30-year long history of closing deals of all sizes.
2. The sellers, mainly family owned businesses, trust TFI’s long term plan.
TFI is expected to close its most recent U.S. acquisition DLS Worldwide in early November, in a deal valued at US$225 million. The company still has over $1.2 billion of liquidity available for more M&As. The next large acquisition is most likely going to be in the U.S., ideally in the Truckload or Logistics segment.
In the meantime, the plan is to keep purchasing competitors in Canada as long as they are small enough to avoid the scrutiny from the Competition Bureau in Ottawa. The company’s modus operandi on most of its acquisitions is simply to take the drivers, keep the good receivable accounts and close the bad ones.
High Ranking
Our ranking system flagged the company as an opportunity in March 2020. As the price fell as much as 49% from its high, TFI’s rank changed from 66.5 to 91.8 when the stock was trading around $15 per share. Since then, the stock more than tripled to reach $50 per share. Despite this surge, its ranking is still in the first decile which makes us believe there are more gains ahead.
| Ranking (%) | Quality (30%) | Value (50%) | Momentum (20%) |
| 94.3 | 51.7 | 94.3 | 99.0 |
Source: S&P Global/Compustat and Factor-Based
Our ranking is made of 12 quality, value and momentum factors. Detailed calculations and definitions are available in the Canadian Equity Strategy presentation on our website. The ranking is obtained by weighting the grade of each factor and normalizing the rank to a percentile. To better understand why TFI is ranked a 94.3, let’s look at each factor and discuss relevant metrics:
Quality
With a rank of 51.7, TFI’s quality factor doesn’t seem appealing at first glance. This is because the management raised US$199 in a U.S. IPO earlier this year. This had a significant impact on the total yield metric, calculated as the (equity purchased – equity issued + dividend) / EV, which is dragging the rank for the quality category lower. However, this should improve in a near future.
Another metric we look at are free cash flow margins. Despite the COVID-19 pandemic, the company managed to double these margins in a year by being more efficient. This is also a reflection of the increased participation of the company in the B2C & E-Commerce boom across North America.
Source: S&P Global/Compustat and Factor-Based
The company did receive wage subsidy benefits that helped propel operating margins. However, the CEO believes organic growth and new acquisitions should more than compensate when they disappear next year. Analysts are estimating free cash flow margins to increase from 8.3% to 10.9% next year.
Value
When it comes to valuation, we backtested hundreds of value metrics over the last 20 years. Some of them are simple ratios such as Price / Earnings while others are very complex such as Economic Value Added (EVA) ratios. Based on our research, we found that discounted free cash flows divided total assets is a good metric for valuing stocks within the Canadian universe.
We frequently use a scatter plot for screening purposes. This allows us to visualize stocks that are considered as quality trading at a reasonable price (NYSEARCA:QARP). The X-axis is the free cash flow margin while the Y-axis is the discounted free cash flow divided by total assets. Please note we removed stocks with incomplete or negative data to ease the chart reading.
The plot below shows how TFI stacks up against other industrials. We added a best-fit line in blue with upper and lower boundaries showing the relationship of value in terms of quality. The higher the estimated FCF margins, the higher the estimated DCF/Assets valuation. The company is undervalued relative to its peers which is why TFI ranks as high as 94.1 for value.
Momentum
When the COVID-19 pandemic appeared, investors feared it would exacerbate the truck driver shortage and create a much weaker demand for freight transportation. As months passed, worries are slowly dissipating and the trucking industry seems to be more resilient to this environment.
As a result, the stock price is up 33% YTD, 30% more than the S&P TSX. Our ranking takes into consideration both price and earnings momentum for this factor. In both cases, earning revisions are positive and the long-term trend remains intact which explains why TFI rank of 99.1 for momentum.
As we are writing this report, TFI stock fell -7% as investors are anxious at the highly uncertain outcome of the U.S. elections on November 3rd. Price may find a support at the current price level of $60.50 per share as shown below. If not, the next price support is lower at approximately $53.25 per share.
Final Thoughts
Companies in the first decile of our ranking have historically outperformed the S&P TSX by 11.6% each year as shown below. We believe the recent price pullback to be a great opportunity to initiate a position or accumulate. As the CEO said this third quarter, 2021 looks more promising but he wants to stay conservative. After all, he prefers to under promise and over deliver.
Looking for a model portfolio strategy with stocks like this one? TFII is a position in our Factor-Based Canadian Equity Strategy since July 2nd 2020. Our Strategy holds 25 quality large cap companies trading at an attractive price.